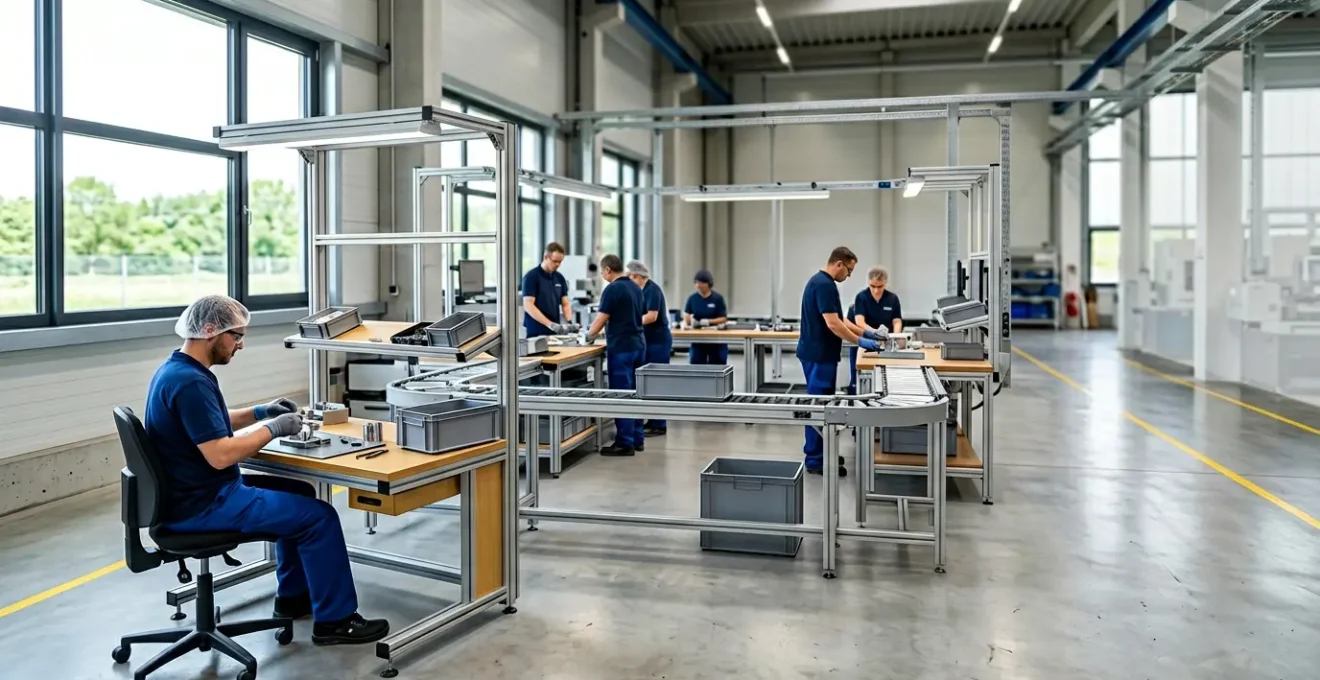
Your 12-week lead time isn’t a resource problem; it’s a systemic friction problem. The counter-intuitive truth is that adding more staff to a broken process will only increase chaos and costs.
- True acceleration comes from surgically removing non-value-added steps, not from increasing workforce or machine speed in isolation.
- Value Stream Mapping reveals the hidden bottlenecks, while modern Process Mining quantifies their exact cost in real-time.
Recommendation: Stop firefighting symptoms. Start by mapping one critical value stream from order to delivery to expose the core constraints in your operational DNA.
As a UK Manufacturing Plant Director, you’re facing a harsh reality. Your lead times have ballooned to twelve weeks, while nimbler competitors are delivering in four. The board is demanding answers, customers are getting impatient, and the pressure on your production schedule is immense. The conventional wisdom is to throw more resources at the problem: hire more operators, approve more overtime, maybe even invest in a faster machine. You’re told to « eliminate waste » and « be more efficient, » but these phrases feel like hollow platitudes when you’re navigating the daily chaos of the factory floor.
But what if this entire approach is fundamentally flawed? What if adding more people is not just ineffective, but actively detrimental to your output? The real challenge isn’t a lack of resources, but the presence of invisible systemic friction—the accumulated sludge of non-value-added steps, poor workflow, and misaligned processes that grinds your production to a halt. This is the core of your operational DNA, and it’s resistant to simple fixes. The solution lies not in working harder, but in fundamentally rewiring how work flows through your facility.
This guide moves beyond the generic advice. It is a strategic blueprint for a Plant Director ready to make decisive changes. We will dissect the physics of your workflow, arm you with the right diagnostic tools, and provide a clear, sequenced plan to reclaim your schedule. You will learn to see your factory not as a collection of separate processes, but as a single, interconnected system. By mastering this perspective, you will transform your chaotic factory into a precise machine, capable of meeting demand with speed and predictability.
This article provides a structured path to achieving that transformation. By understanding each component, you will build a comprehensive strategy to overhaul your production, drastically cut lead times, and regain your competitive edge. The following sections break down the essential pillars of this Lean implementation.
Contents: A Master Black Belt’s Guide to Accelerating Your Production Schedule
- Why Does Adding More Staff to a Broken Workflow Actually Decrease Final Output?
- How to Map Your Value Stream to Identify Hidden Production Bottlenecks?
- Six Sigma vs Lean Manufacturing: Which Fits UK Mid-Sized Facilities Best?
- The Quality Control Shortcut That Ruins Your Final Product Tolerances
- In What Order Should You Remove Non-Value-Added Steps From the Factory Floor?
- Value Stream Mapping vs Process Mining: Which Identifies Hidden Waste Best?
- How to Reconfigure Your Assembly Line Layout to Reduce Material Handling Time?
- How to Eliminate Non-Value-Added Steps Without Sacrificing Quality Control?
Why Does Adding More Staff to a Broken Workflow Actually Decrease Final Output?
The instinctive reaction to a production backlog is to increase capacity by adding more people. Yet, experienced directors often watch in dismay as this leads to more congestion, communication breakdowns, and a negligible, or even negative, impact on final output. This isn’t a paradox; it’s a predictable outcome of violating the fundamental physics of workflow. A broken process is defined by its bottlenecks, and adding resources anywhere else in the chain only serves to pile up work-in-progress (WIP) faster at the point of constraint. This increases inventory costs, extends lead times, and creates what is known as systemic friction.
This phenomenon, known as Brooks’s Law in software development, applies directly to manufacturing: adding manpower to a late project makes it later. Why? Because new staff require training, increase communication overhead, and can disrupt the established (albeit inefficient) rhythm of the existing team. If there are fragmented perceptions of how the work should be done, as is common in unoptimized environments, new personnel simply add to the confusion. This reality is reflected in broader industry trends; research shows UK manufacturing productivity growth dropped dramatically to a mere 0.7% annual average from 2011-2019, compared to 4% in the preceding period. The old levers aren’t working.
Instead of adding resources, a Master Black Belt’s first move is to subtract waste. The focus must shift from ‘how can we work faster?’ to ‘why are we being forced to wait?’. Before hiring a single additional operator, you must dissect the current state. Analyse the coordination requirements, the complexity of tasks, and the patterns of human movement. Only by understanding the operational DNA of your current workflow can you identify the true constraints. Adding staff is a costly last resort, to be considered only after the process itself has been healed and stabilised.
This counter-intuitive principle is the first and most critical lesson in Lean transformation. It forces a shift from a resource-based mindset to a flow-based one, which is the only path to sustainable speed.
How to Map Your Value Stream to Identify Hidden Production Bottlenecks?
If you can’t see the problem, you can’t solve it. A Value Stream Map (VSM) is the foundational tool that translates the chaos of your factory floor into a clear, data-driven picture. It is not merely a process diagram; it is a diagnostic X-ray of your entire workflow, from raw material receipt to customer delivery. Its purpose is to make waste visible by meticulously documenting every step, both value-added and non-value-added. For a Plant Director, this is the single most powerful tool for moving from opinion-based management to fact-based decision making.
The process of creating a VSM is as important as the map itself. It starts by forming a cross-functional team, combining operators, supervisors, and engineers who understand the process intimately. This team physically walks the flow—an act known as « going to the Gemba »—to observe reality, not the idealised version in a standard operating procedure. They collect data at each step: cycle time, changeover time, uptime, and, most crucially, the waiting time between steps. It is in these « in-between » spaces, the queues of WIP, that the biggest opportunities for lead time reduction are found.
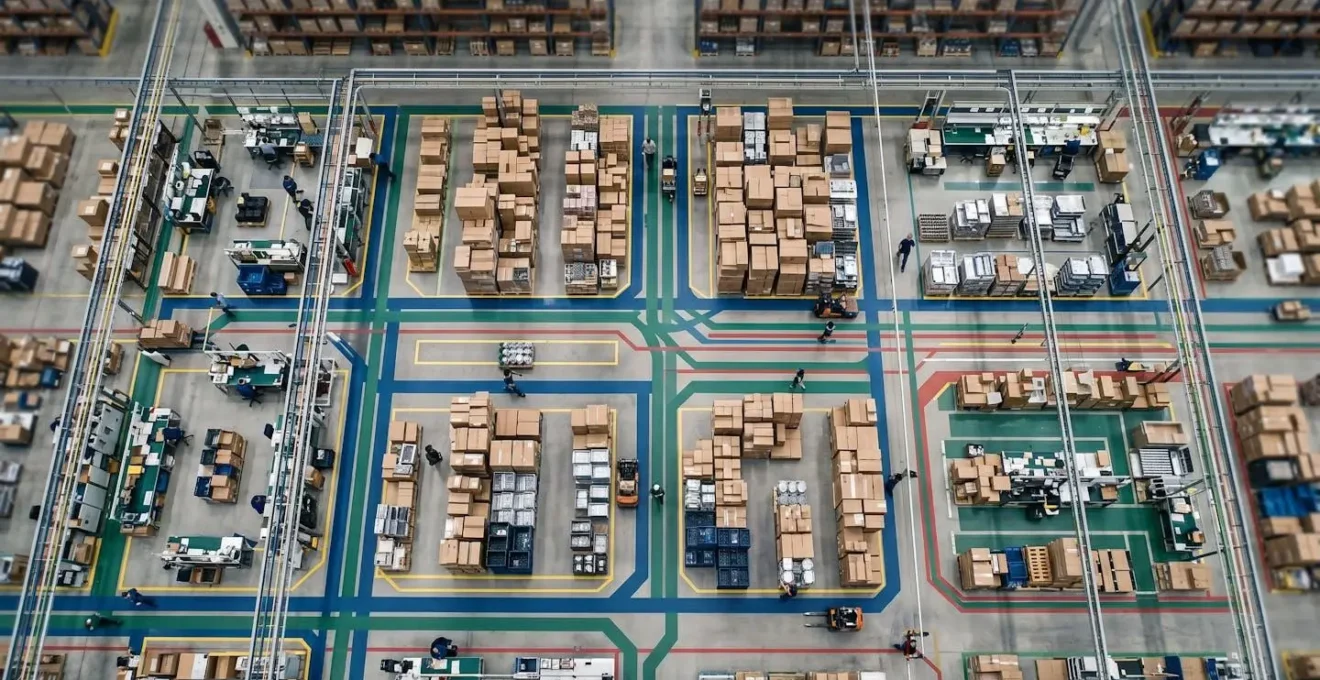
As the map above illustrates, the goal is to visualise the flow of both material and information. The VSM exposes where value is truly created and where time is lost to unnecessary transport, inventory, motion, waiting, overproduction, over-processing, or defects. Once the « current state » map is complete, the team can identify the pacemaker process—the single point that dictates the rhythm for the entire upstream value stream. This is your primary bottleneck and the first target for improvement, allowing you to design a lean, fast, and connected « future state » flow.
Your Action Plan: VSM Readiness Audit
- Points of contact: Have you identified a leader from each department (e.g., procurement, assembly, QC, shipping) to form the VSM team?
- Collecte: Do you have a baseline of existing process documents, floor layouts, and any initial performance data (e.g., OEE, scrap rates)?
- Coherence: Does the team agree on the product family to map and the start/end points of the value stream (e.g., from customer order to customer shipment)?
- Mémorabilité/émotion: Can the team clearly distinguish value-added time (what the customer pays for) from non-value-added time (waste)?
- Plan d’intégration: Is a « future state » workshop scheduled to analyse the findings and design a prioritised implementation plan based on the identified bottlenecks?
This initial map becomes your strategic guide, showing you precisely where to focus your resources to achieve the greatest impact on your production schedule.
Six Sigma vs Lean Manufacturing: Which Fits UK Mid-Sized Facilities Best?
Once you’ve committed to process improvement, a critical strategic question arises: Should you follow a Lean or a Six Sigma methodology? While often used interchangeably, they are distinct philosophies designed to solve different types of problems. For a UK mid-sized facility, choosing the right primary approach is crucial to avoid wasting resources on an ill-suited framework. Lean is fundamentally about speed and efficiency. Its primary goal is to maximise customer value by relentlessly eliminating waste, thereby reducing lead time. It tackles issues like slow production, excessive inventory, and long setup times.
Six Sigma, on the other hand, is about precision and quality. Its primary goal is to eliminate defects and reduce process variation. It uses a rigorous, data-heavy framework (DMAIC: Define, Measure, Analyze, Improve, Control) to solve complex problems with unknown root causes, such as high scrap rates or inconsistent product tolerances. While Lean makes your process fast, Six Sigma makes your process perfect. A facility struggling with a 15% scrap rate needs Six Sigma’s statistical rigour more than it needs Lean’s flow optimisation at that moment.
The table below, based on an established application framework, provides a clear guide for when to apply each methodology. For many mid-sized plants, the most practical approach is not an « either/or » choice but a « Lean first, then Six Sigma » sequence. Use Lean to clear out the obvious waste and stabilise the flow. This creates a more predictable environment where the statistical tools of Six Sigma can then be effectively applied to fine-tune quality and eliminate the more complex, variation-based problems.
This pragmatic approach is confirmed by industry data. As detailed in a recent analysis of manufacturing improvements, different problems require different toolsets. The key is to match the tool to the specific challenge you are facing right now.
| Problem Type | Recommended Approach | Tools to Use |
|---|---|---|
| Production too slow | Lean Manufacturing | VSM, 5S, Flow optimization |
| High scrap rate (15%+) | Six Sigma DMAIC | Statistical analysis, Root cause |
| Setup time issues | Lean (SMED) | Quick changeover techniques |
| Complex quality variations | Six Sigma | SPC, DOE, DMAIC |
| Inventory excess | Lean (JIT/Kanban) | Pull systems, Kanban cards |
For a Plant Director with stretching lead times, the immediate priority is almost always flow. Start with Lean to create speed and stability, then layer in Six Sigma to perfect quality and drive variation toward zero.
The Quality Control Shortcut That Ruins Your Final Product Tolerances
In a high-pressure environment, one of the most tempting—and destructive—shortcuts is to de-prioritise in-process quality checks in favour of a final inspection. The logic seems plausible: « Let’s just get the product built, and we’ll catch any problems at the end of the line. » This approach is the antithesis of Lean thinking and is a primary driver of both poor quality and long lead times. A final inspection station doesn’t create quality; it only documents failure. By the time a defect is caught at the end, the time, materials, and labour invested in that unit are already lost. Worse, it creates a feedback loop that is far too slow to prevent the same defect from being repeated on hundreds of other units.
The robust alternative is to build quality into the process itself. This is the principle of Jidoka, or autonomation, a cornerstone of the Toyota Production System. It empowers every operator to act as a quality inspector and gives them the authority to stop the line the moment a problem is detected. This prevents a defect from ever being passed downstream. It’s a radical shift from policing quality to enabling it at the source.
Jidoka — often translated as ‘autonomation’ or ‘automation with a human touch’ — is the principle of designing equipment and processes to detect abnormalities and stop automatically the moment a problem occurs, rather than passing defects downstream.
– Lean Manufacturing Principles, Wikipedia – Toyota Production System
Implementing Jidoka involves using simple, often low-cost, error-proofing devices (Poka-Yoke) and visual signals (Andon systems) that make abnormalities immediately obvious. This is supported by a disciplined problem-solving cycle like PDCA (Plan-Do-Check-Act) and rigorous root cause analysis. Instead of relying on a handful of inspectors at the end, you create a culture where dozens of operators are actively preventing defects at every step. This not only dramatically improves final product quality and tolerance consistency but also shortens lead times by eliminating the significant rework loops and scrap that are inherent in a final-inspection-based system.

Abandoning the final inspection shortcut isn’t about adding more work; it’s about doing the work right the first time, which is ultimately faster, cheaper, and the only sustainable way to protect your brand’s reputation for quality.
In What Order Should You Remove Non-Value-Added Steps From the Factory Floor?
Once your Value Stream Map has exposed the sheer volume of waste in your process, the next question is where to begin. A haphazard approach, picking off random bits of waste, will create localised improvements but fail to impact the overall lead time. The removal of non-value-added steps must be a surgical, sequenced process guided by a clear strategy. The seven classic wastes (Transport, Inventory, Motion, Waiting, Overproduction, Over-processing, Defects – TIMWOOD) provide a framework for what to look for, but not the order in which to attack them.
The first priority is always stability. Before you can improve flow, you must remove the sources of variability and unpredictability. This means starting with waste that causes inconsistency, such as unreliable equipment (leading to downtime) or inconsistent component quality (leading to defects and rework). Stabilising the process creates a predictable baseline from which all other improvements can be measured. Once the system is stable, the focus shifts to the pacemaker process identified in your VSM. Any improvement at the bottleneck directly translates to an improvement in overall system throughput.
To prioritise actions, use an Impact/Effort Matrix. Plot potential improvements on a 2×2 grid, with one axis representing the potential impact on lead time or cost, and the other representing the ease of implementation (time, cost, resources). This immediately highlights the « quick wins »—high-impact, low-effort projects that build momentum and secure buy-in for more significant changes. A successful project in a Peruvian textile mill, for example, followed this focused approach and reported a 25.59% enhancement in process cycle efficiency by methodically removing these identified wastes. The sequence is critical: first stabilise, then attack the bottleneck, using the matrix to pick the right initial battles.
This structured approach transforms waste removal from a random « whack-a-mole » activity into a strategic campaign that systematically enhances flow and accelerates your entire production schedule.
Value Stream Mapping vs Process Mining: Which Identifies Hidden Waste Best?
Value Stream Mapping is the essential, hands-on tool for understanding your intended process flow. However, its primary limitation is that it provides a static snapshot, often representing the « ideal » path rather than the messy reality. It relies on manual observation and can miss the unofficial workarounds, deviations, and « shadow processes » that operators use to get the job done. This is where Process Mining emerges as a powerful digital complement. It acts as a real-time, automated VSM that shows you what is *actually* happening, not just what you *think* is happening.
Process Mining works by extracting digital footprints—event logs—from your existing IT systems like your ERP or MES. It then automatically visualises the real process flows, including every variation and deviation. Instead of estimating waste, Process Mining can calculate the exact time and cost associated with bottlenecks, rework loops, and non-conforming process variants. It can answer questions that a manual VSM cannot: « What percentage of our orders deviate from the standard process, and how much is it costing us in delays? » or « Which specific approval step is the biggest source of waiting time across all shifts? »

For a modern manufacturing facility, the choice isn’t VSM *or* Process Mining; it’s VSM *and* Process Mining. Use VSM for the initial, high-level strategic overview and to engage the team on the factory floor. Then, deploy Process Mining to dive deeper, validate the VSM’s findings with hard data, and uncover the hidden waste that manual observation misses. The following table highlights the distinct capabilities of each approach, clarifying how they work together to provide a complete picture of your operations.
As explained in a contemporary guide to Lean principles, leveraging digital tools is key to unlocking the next level of efficiency. The combination of manual insight and digital data is unbeatable.
| Aspect | Value Stream Mapping | Process Mining |
|---|---|---|
| Data Source | Manual observation & documentation | Digital event logs from ERP/MES |
| Analysis Type | Static snapshot of ideal process | Real-time continuous monitoring |
| Waste Detection | Estimates waste levels | Calculates exact waste cost |
| Hidden Issues | May miss unofficial workarounds | Reveals all digital deviations |
| Update Frequency | Periodic manual updates | Continuous automated updates |
By pairing the strategic, human-centric insights of VSM with the objective, granular data from Process Mining, you gain an unparalleled, 360-degree view of your factory’s hidden waste.
How to Reconfigure Your Assembly Line Layout to Reduce Material Handling Time?
An inefficient factory layout is a constant source of waste, forcing unnecessary material handling, excess transportation, and wasted motion from operators. If your VSM reveals significant travel distances or waiting time for parts, a reconfiguration of the physical assembly line is often the highest-impact improvement you can make. The goal is to move from a fragmented, process-based layout (e.g., all lathes in one area, all drills in another) to a streamlined, product-focused flow where machines are organised in the sequence of production.
The most common and effective solution is the U-shaped cell. This layout places different machines in a « U » formation, allowing a single operator, or a small team, to manage multiple steps of the process with minimal movement. It dramatically reduces the distance parts have to travel and facilitates better communication and teamwork. This cellular layout is often supported by line-side « Point-of-Use Supermarkets »—small, dedicated storage areas that hold just enough inventory for the immediate production run. This eliminates long trips to a central warehouse.
To keep these cells supplied, best practice dictates the creation of a dedicated « Water Spider » (Mizusumashi) role. This is a material handler responsible for replenishing the line-side supermarkets on a fixed schedule, allowing the skilled operators to remain focused on value-added assembly tasks. For more complex assemblies or high-mix environments, other layouts like S-shaped, Z-shaped, or « Rabbit Chase » lines can be considered, but the principle remains the same: arrange the physical world to match the desired flow of value, not the other way around.
Case Study: Toyota’s 2025 Localised Layout Strategy
Looking ahead, Toyota is evolving this concept for its next-generation battery manufacturing. The TBMNC plant is a prime example of a highly localised strategy. It features meticulously configured battery cell supply chains and uses advanced planning tools to optimise inbound logistics based on local conditions. The physical layout is designed to be tightly coupled with a hyper-optimised, local supply chain, minimising material handling on a macro scale before it even enters the factory.
A well-designed layout is a physical manifestation of Lean thinking. It makes the efficient flow of work the path of least resistance, inherently reducing waste and accelerating your schedule.
Key Takeaways
- Adding staff to a flawed process amplifies waste; focus on fixing the flow first.
- Value Stream Mapping makes waste visible, but Process Mining quantifies its true cost in real-time.
- Lean focuses on speed and flow, while Six Sigma targets quality and variation. Use Lean first to stabilise, then Six Sigma to perfect.
How to Eliminate Non-Value-Added Steps Without Sacrificing Quality Control?
The ultimate goal of a Lean transformation is to create a process where only value-added activities remain. The scale of this opportunity is staggering; research from the Lean Enterprise Research Centre (LERC) suggests that fully 60% of production activities in a typical manufacturing operation are waste—they add absolutely no value for the customer. The fear that often paralyses directors is that in surgically removing this waste, they might also cut out a critical quality control check. This fear, however, is based on a misunderstanding of how Lean and Quality interact.
A truly Lean process does not sacrifice quality control; it makes most of it redundant. Traditional quality control relies on inspection after the fact. A Lean system, built on the principle of Jidoka, builds quality into every step. By empowering operators to stop the line and by implementing error-proofing (Poka-Yoke) devices, you prevent defects from occurring in the first place. The focus shifts from catching defects to eliminating their root causes. This approach doesn’t remove quality control; it integrates it into the DNA of the production process itself, making it more robust and immediate.
The historic case of NCR’s factory in Dundee, Scotland, provides a powerful testament to this. By implementing a Just-in-Time (JIT) system over a single weekend, they didn’t just cut waste. They eliminated buffer inventories, which forced them to address quality issues immediately as they had no stock to fall back on. The results were transformative: inventory was reduced from 47 days to just 5, and flow time plummeted from 15 days to 2. This demonstrates the core principle: eliminating non-value-added steps (like excess inventory) forces an improvement in quality and dramatically accelerates the entire system.
To begin your transformation, stop viewing waste elimination and quality control as opposing forces. Instead, see them as two sides of the same coin. A process free of waste is inherently a process with higher quality, greater predictability, and the speed your customers demand.